5.1. Tutorial: Land Cover Signature Classification
This tutorial is about the Класифікація сигнатур земного покриву. It is assumed that one has the basic knowledge of SCP and Базові навчальні матеріали.
Following the video of this tutorial.
http://www.youtube.com/watch?v=wUr5ZjpWBo0
First download the sample image from this link (© Copernicus Sentinel data 2016) which is a Sentinel-2 image, and unzip the file.
5.1.1. Create the Band Set
Open the tab  Набір каналів, click the button
  and select the bands of the downloaded Sentinel-2 image.
In the table Band set definition order the band names in ascending order (click
and select the bands of the downloaded Sentinel-2 image.
In the table Band set definition order the band names in ascending order (click  to sort bands by name automatically), then highlight band
 8A (i.e. single click on band name in the table) and use the buttons  or
or  to place this band at number 8.
Finally, select Sentinel-2 from the list Quick wavelength settings, in order to set automatically the Center wavelength of each band and the Wavelength unit (required for spectral signature calculation).
to place this band at number 8.
Finally, select Sentinel-2 from the list Quick wavelength settings, in order to set automatically the Center wavelength of each band and the Wavelength unit (required for spectral signature calculation).
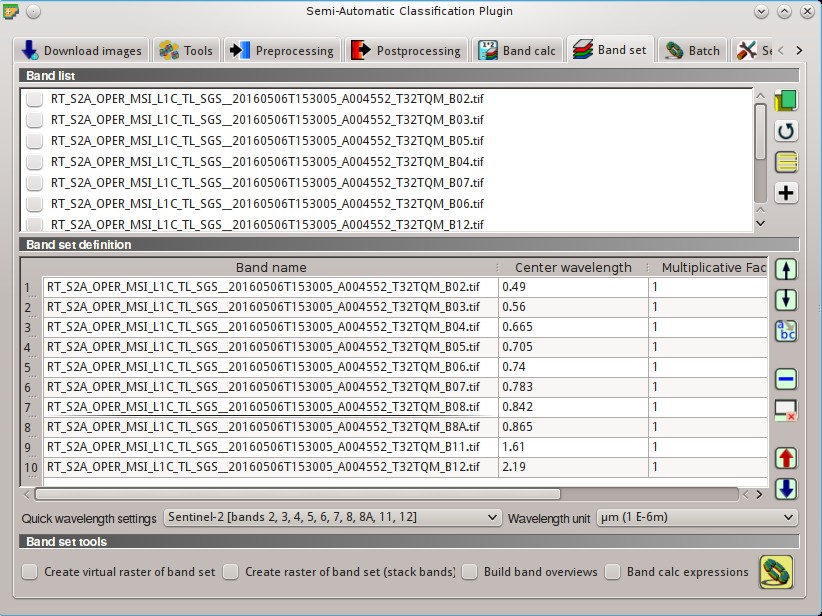
Band set definition
5.1.2. Create the ROIs and Define the Spectral Thresholds
In the Панель SCP click the button  and define a file name for the Training input.
We are going to create ROIs similarly to Навчальний практикум 2: Класифікація земельного покриву за знімками Sentinel-2.
and define a file name for the Training input.
We are going to create ROIs similarly to Навчальний практикум 2: Класифікація земельного покриву за знімками Sentinel-2.
We are going to use the following Macroclass IDs (see Класи та макрокласи).
Macroclasses
| Macroclass name | Macroclass ID |
|---|---|
| Water | 1 |
| Built-up | 2 |
| Vegetation | 3 |
| Bare soil | 4 |
In addition, we can mask clouds in the image, creating ROIs of clouds and assigning the special MC ID = 0.
In the list RGB= of Робоча панель define a Кольоровий композит such as RGB = 3-2-1 or RGB = 7-3-2.
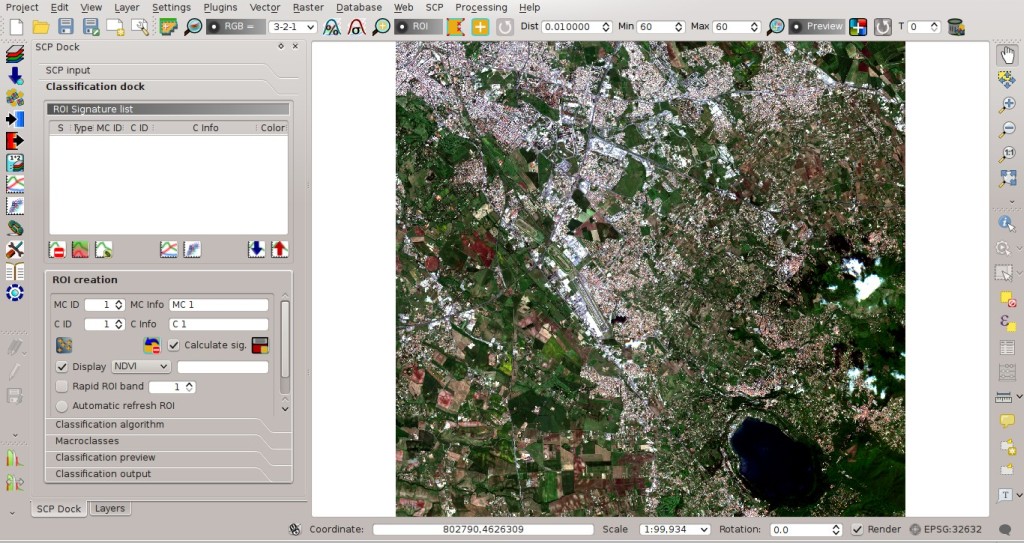
Color composite
Now create some ROIs. ROIs are used in Класифікація сигнатур земного покриву for defining a spectral region. The Класифікація сигнатур земного покриву can use additional classification algorithms for pixels falling inside overlapping regions or outside any spectral region (in this tutorial we are going to use Мінімальної відстані), therefore it is important that ROIs are homogeneous in order to train correctly the additional algorithm. Following the ROI creation we are going to change the signature thresholds in the Порогові величини LCS.
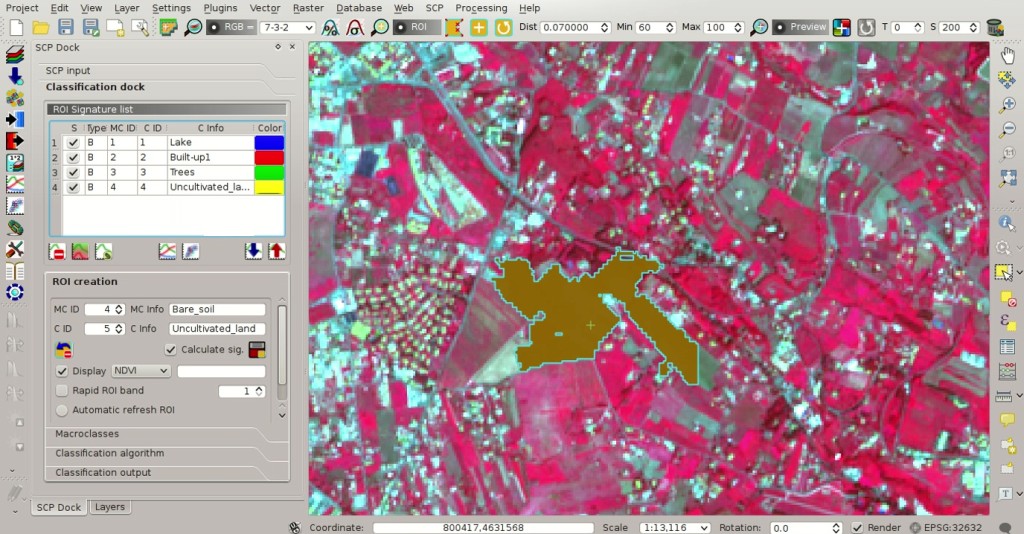
ROI creation
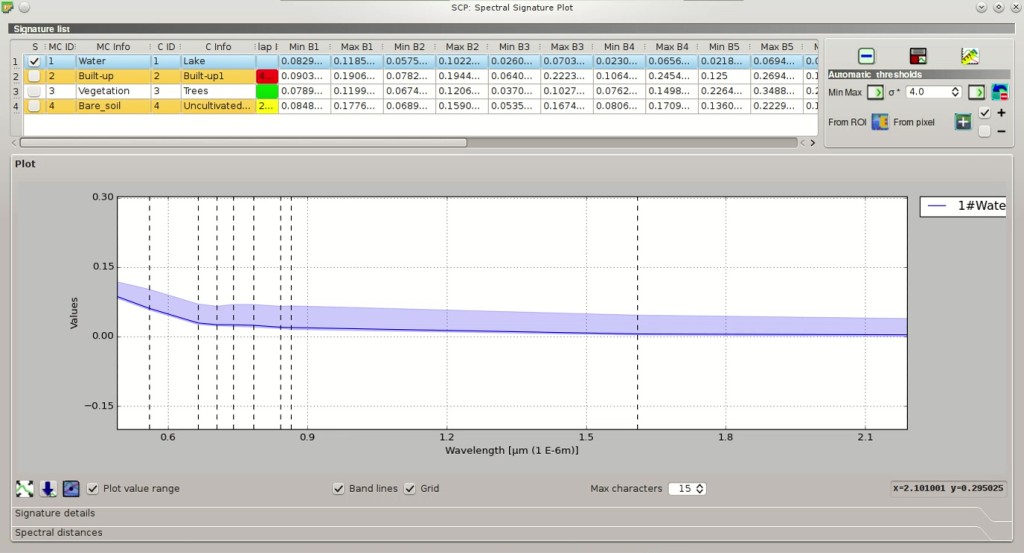
After the ROI creation, in the Перелік сигнатур ROI highlight these spectral signatures, then click the button  .
.
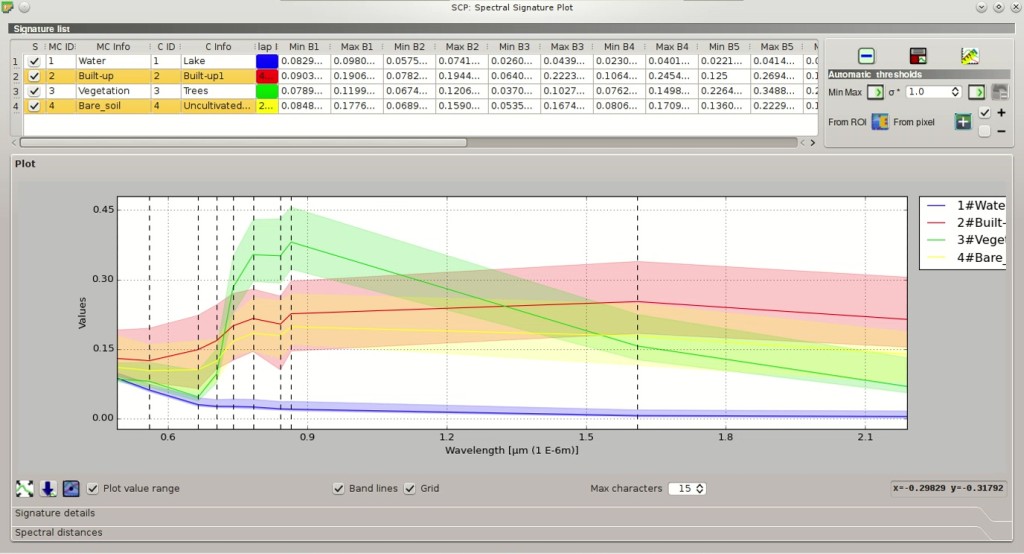
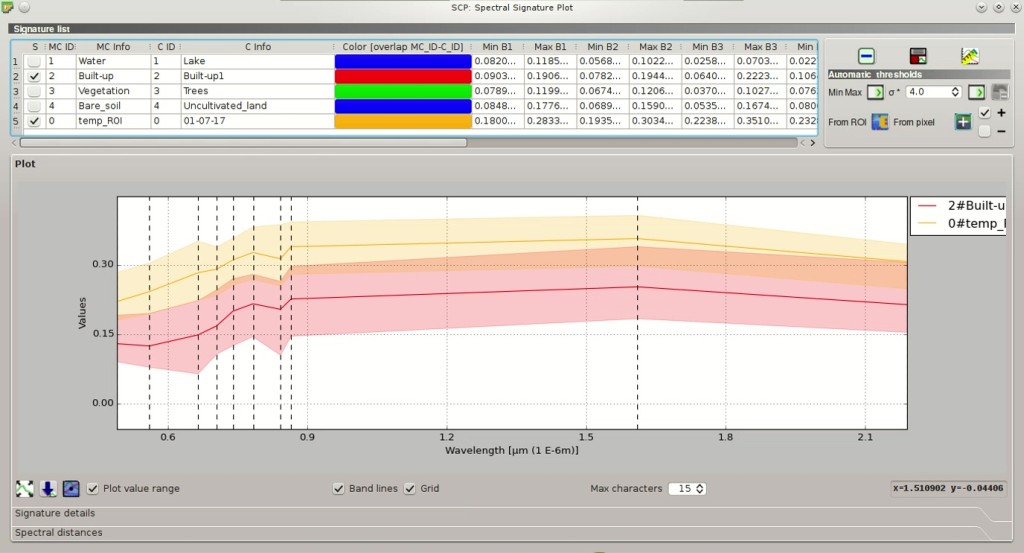
Signature plot
Spectral signatures are displayed with the respective colors; also, the semi-transparent area represents the spectral range of each ROI. The minimum and maximum values of these spectral range are displayed in the Відобразити Перелік сигнатур. You can manually edit these ranges or use the tools Автоматичні порогові величини. It is worth noticing the same spectral ranges (of spectral signatures in Перелік сигнатур ROI) are displayed in the Порогові величини сигнатур.
In Алгоритм класифікації select Use  LCS to use the in Класифікація сигнатур земного покриву.
Now create a classification preview over the lake (see Створіть попередній перегляд результатів класифікації).
LCS to use the in Класифікація сигнатур земного покриву.
Now create a classification preview over the lake (see Створіть попередній перегляд результатів класифікації).

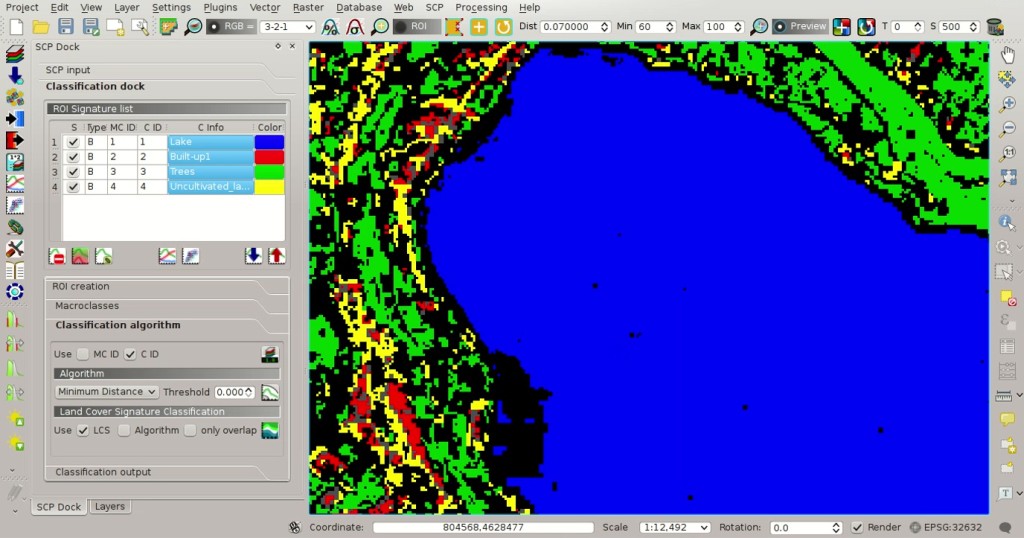
Classification preview
You can see that several pixels are unclassified (black) because they are outside any spectral range.
In the Відобразити Перелік сигнатур highlight a signature of macroclass Water and click the button From pixel  .
This tool allows you to extend the spectral range to include a pixel signature.
Click an unclassified pixel in the map over the lake; you should see that the spectral range of highlighted signature is larger now.
Click the button
.
This tool allows you to extend the spectral range to include a pixel signature.
Click an unclassified pixel in the map over the lake; you should see that the spectral range of highlighted signature is larger now.
Click the button  in the Робоча панель.
Classification preview
Now the area classified as water is larger and should include the pixel that was clicked before.
Create a temporary ROI over the unclassified area of the lake and click the button From ROI  .
.
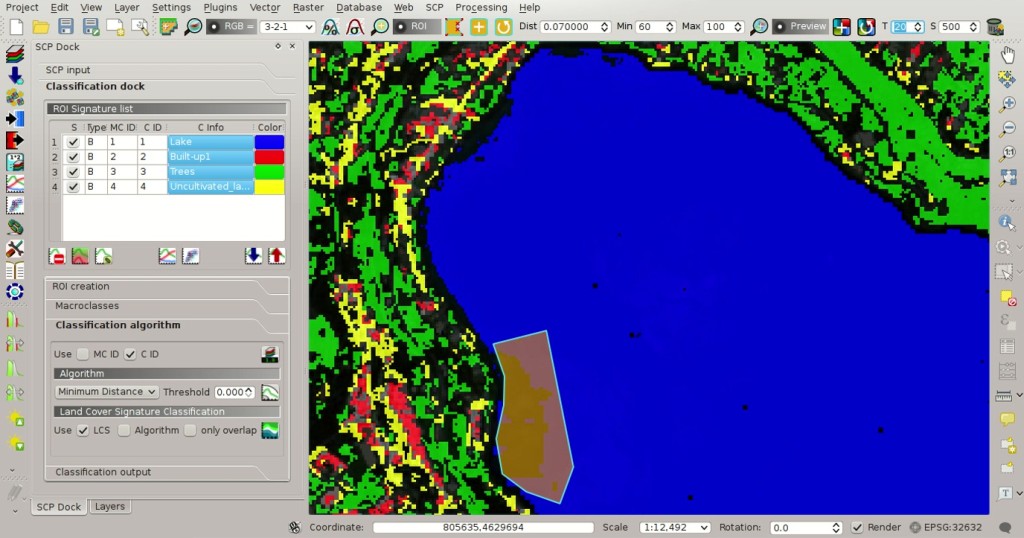
Signature plot: the spectral range is extended
This way, the spectral range is extended to include the minimum and maximum value of this ROI for each band.
Signature plot: the spectral range is extended
Creating another classification preview we can see that the classified area is extended according to the temporary ROI.

Classification preview
You can extend the spectral range to classify the whole lake as water.
TIP : During ROI creation, click the buttonin Робоча панель and right click on the map for displaying the spectral signature of a pixel in the Графік спектральних сигнатур. This can be useful for assessing unclassified pixels and extend one or more spectral ranges.
Particular attention should be posed on the spectral similarity of classes. For instance soil and built-up can have very similar spectral signatures. Therefore, several ROIs should be collected in the attempt to separate these classes.
Spectral ranges should not overlap in order to avoid unclassified pixels.
In the following figure, two signatures have overlapping ranges (it means that potentially there is a signature whose values fall in two classes); these signatures are highlighted in orange in the Відобразити Перелік сигнатур (also in the Порогова величина LC) and the combinations MC ID - C ID of overlapping signatures are displayed in the column Color [overlap MC_ID-C_ID].
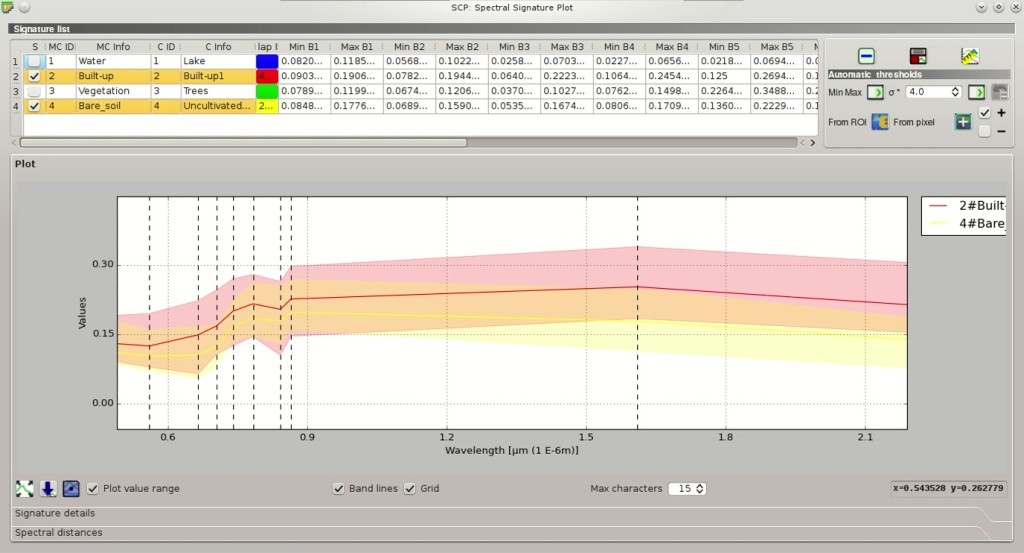
Overlapping signatures
It is possible to reduce the range with the button From ROI or From pixel if the checkbox – is checked.
In this case, the range is reduced to exclude the values of selected pixels or ROIs.
In addition, it is possible to edit the range directly from the plot.
In the Відобразити Перелік сигнатур highlight a signature, click the button  , then click inside the plot to extend or reduce the range.
As a general procedure, you should compare spectral signatures and identify one or more values that could separate the overlapping ranges (if spectral ranges are not overlapping at least in one band then classes are correctly separated).
, then click inside the plot to extend or reduce the range.
As a general procedure, you should compare spectral signatures and identify one or more values that could separate the overlapping ranges (if spectral ranges are not overlapping at least in one band then classes are correctly separated).
In case two spectral regions belonging to different classes are overlapping, you should consider reducing the ranges, collecting other spectral signatures with reduced ranges, or extending the spectral range of one signature to include the range of the other spectral signature that will be deleted. For instance, it could be convenient to create two spectral ranges (with two spectral signatures) for the same class in order to easily separate a third spectral signature whose values are comprised between the minimum and maximum values of the other two ranges.
TIP : Check theAutomatic plot to display automatically the plot of a temporary ROI in the Графік спектральних сигнатур, and assess the spectral range before saving the ROI.
The plot of a temporary ROI
Now check MC ID in Алгоритм класифікації.
When MC ID is checked, the classification is performed using all the spectral signatures (without any modification of original spectral values) but assigning the macroclass code.
Moreover, only overlapping signatures belonging to different macroclasses are highlighted in Відобразити Перелік сигнатур.
This allows spectral signatures sharing the same MC ID to be overlapping.
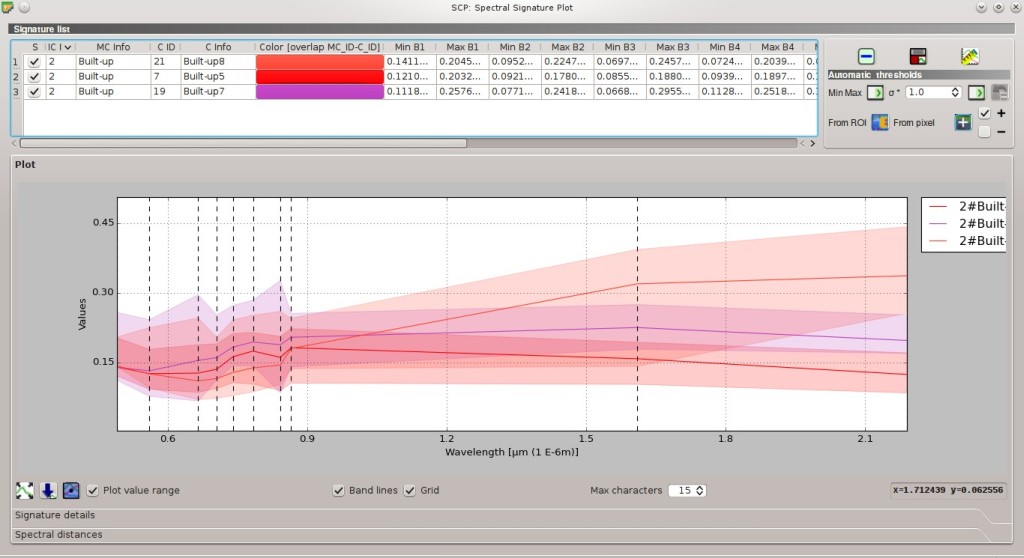
Overlapping regions belonging to the same MC ID
Also, open the tab Порогові величини LCS for checking the overlap of all the spectral signatures saved in the Training input.
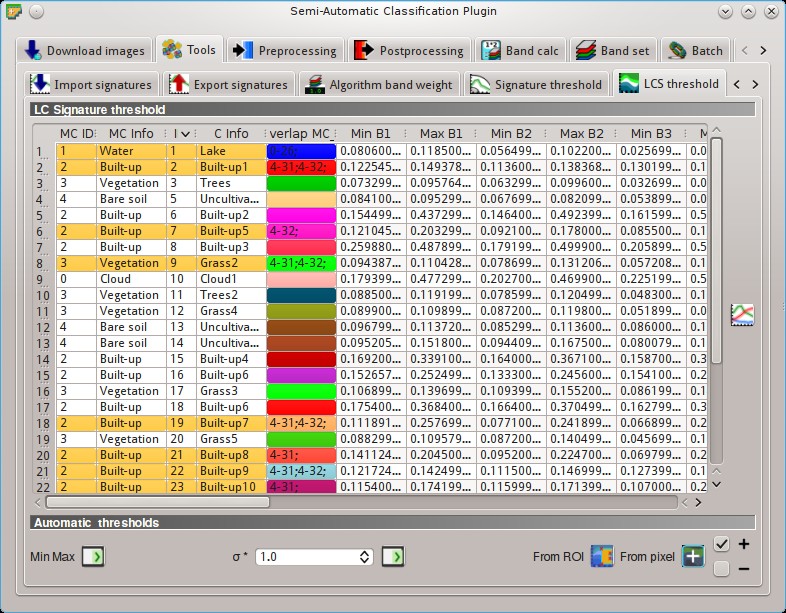
LCS threshold. Overlapping regions are highlighted in orange
5.1.3. Land Cover Classification
After the creation of several ROIs and the definition of spectral ranges, we can perform the classification for the whole image.
Having selected MC ID and LCS in Алгоритм класифікації, click the button  in the Результат класифікації and select an output destination.
After the processing, the classification will be displayed in QGIS.
in the Результат класифікації and select an output destination.
After the processing, the classification will be displayed in QGIS.
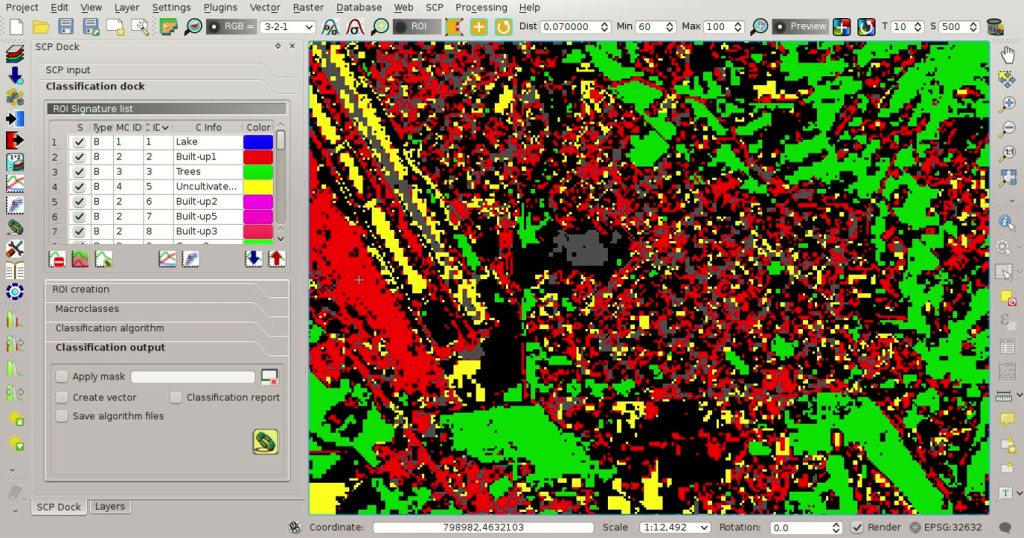
LCS classification
Unclassified pixels, displayed in black, are pixels whose spectral signature is not completely contained in any spectral region. Also, pixels contained in more than one spectral region (having different MC ID) are classified as Class Overlap.
LCS classification. Class Overlap
We could create other spectral regions in order to classify all the unclassified pixels.
Alternatively, we can use the selected Алгоритм for classifying those pixels.
Check the Algorithm in Класифікація сигнатур земельного покриву and select the Мінімальної відстані in Алгоритм; then click the button in the Результат класифікації.
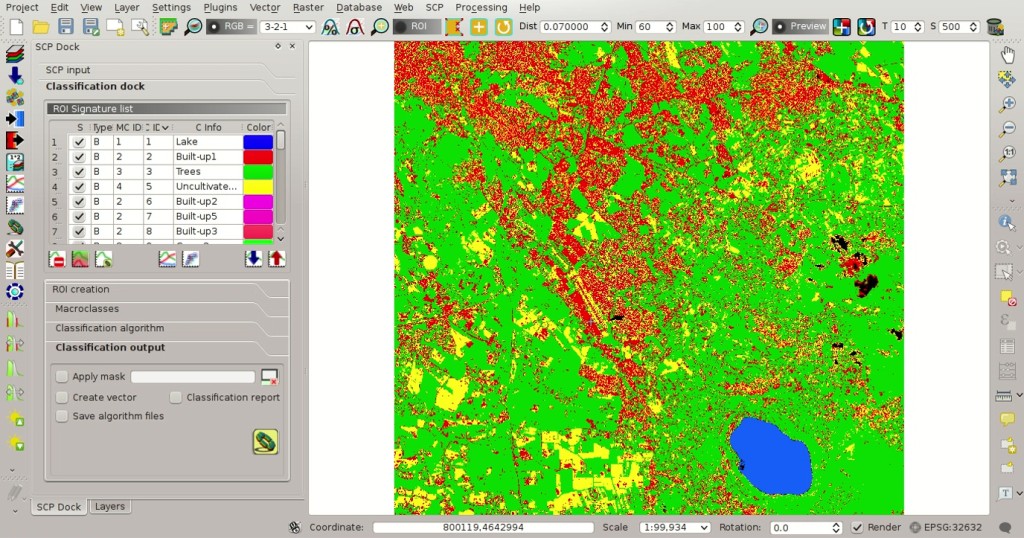
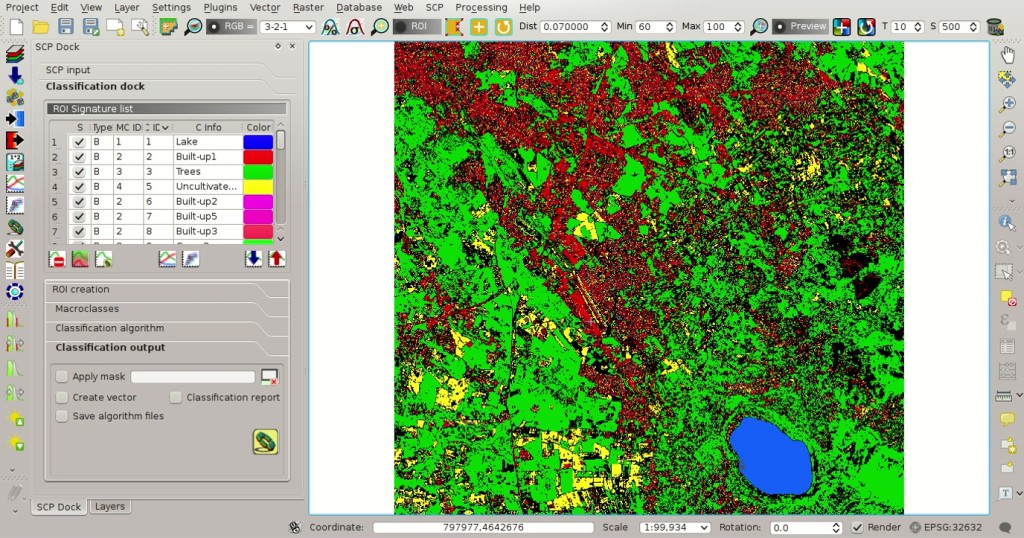
LCS classification. Classification using the additional classification algorithm
Pixels that were unclassified by LCS now are classified using the Мінімальної відстані, which compares calculates the Euclidean distance between pixels and spectral signatures. Black pixels are clouds classified using the special MC ID = 0.
In addition, we can use the Мінімальної відстані to classify only pixels that were labelled Class Overlap by LCS, leaving unclassified pixels whose spectral signature is not completely contained in any spectral region.
Check only overlap in Класифікація сигнатур земельного покриву, leaving checked Algorithm; then click the button in the Результат класифікації.
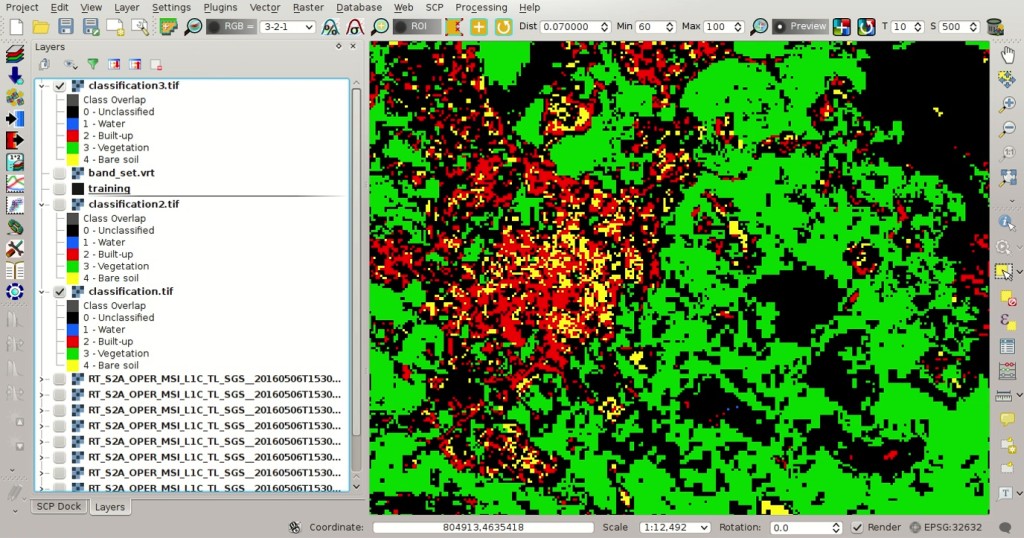
LCS classification. Classification using the additional classification algorithm only for Class Overlap
The Класифікація сигнатур земного покриву can be useful for the classification of a single land cover class, defining only the spectral ranges that identify our objective. For instance, if we were interested in built-up classification only, we could collect only ROIs for this class, obtaining a classification such as in the following image.
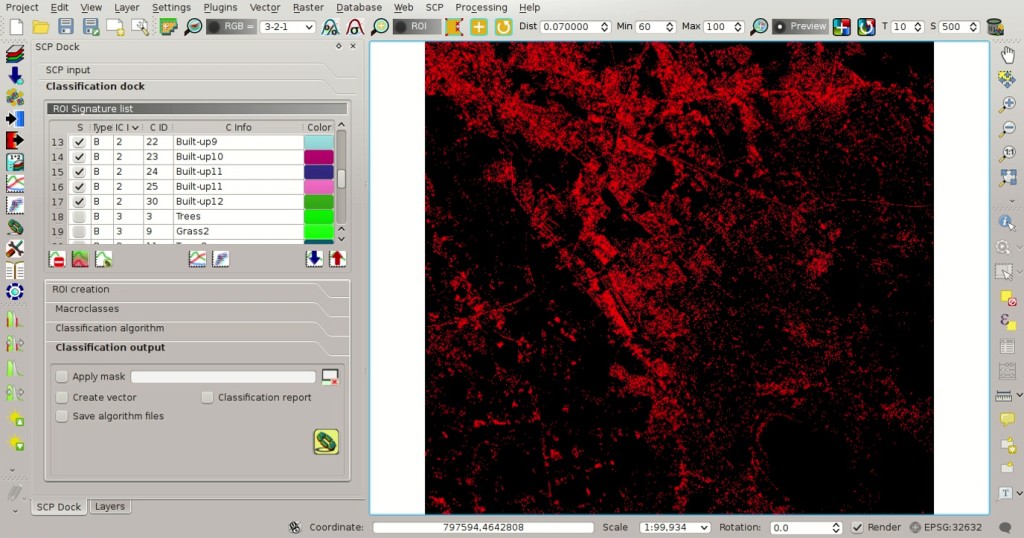
LCS classification. Classification of the class Built-up
5.1.4. Other Tutorials
For other tutorials visit the blog From GIS to Remote Sensing .